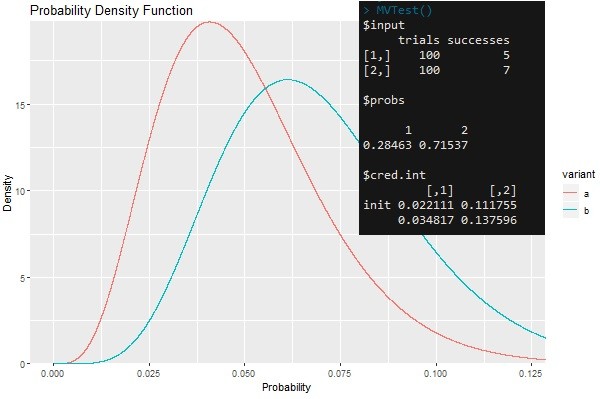
This post overviews code for testing multiple variants using Bayesian statistics. It is especially useful when there is a defined action that can be classified as a success (i.e. a click or conversion) and when we have complete information about the number of trials (i.e. impressions). Full code can be found on GitHub.
This code relies heavily on simulation produced by sampling beta distributions given parameters for trials and successes. No additional packages are necessary outside of base R.
First we define helper functions that act as wrappers for the rbeta and qbeta functions in base R. RBetaWrapper will be used for sampling and QBetaWrapper will be used for calculating credibility intervals.
###############################
## Helpers
###############################
RBetaWrapper <- function(x, r){
  rbeta(r, (x[[2]] + 1), (x[[1]] - x[[2]]) + 1)
  }
QBetaWrapper <- function(x, i){
  qbeta(i, (x[[2]] + 1), (x[[1]] - x[[2]]) + 1)
  }
Our MVTest function accepts number of simulated draws, a trial vector, a success vector, a vector of quantiles to be used in calculating credibility intervals, and an integer specifying how many digits credibility intervals should be rounded.
The function will draw random values from beta distributions implicitly defined by trials and successes corresponding to different variants. It will determine the frequency of how often a draw from the distribution is greatest for each variant. This frequency describes the probability of a variant being superior in the long run. The credibility intervals aid in decision making. If credibility intervals do not overlap then the probabilities in the previous step are significant and one can declare a winning variant. The default credibility intervals are 95% credibility intervals, however these should be changed to be less (or more) conservative depending on your objectives.
<!-- wp:code -->
<pre class="wp-block-code"><code>MVTest <- function(r = 10^5, n = c(100, 100), x = c(5, 7), i = c(0.025, 0.975), rnd = 6){
# MultiVaraint testing using bayesian sampling from beta distributions
# Args:
# r: number of simulated draws from beta distribution
# n: trials vector
# x: successes vector
# i: credibility interval range
# rnd: integer specifying number decmimal places to round credibility interval endpoints
# Returns: Trail and Success input information, comparative predicited long run performance probabilities, credibility intervals
set.seed(777)
nx.list <- split(cbind(n,x), seq(nrow(cbind(n,x))))
samples <- lapply(nx.list, RBetaWrapper, r = r)
intervals <- (lapply(nx.list, QBetaWrapper, i = i))
bindedcols <- Reduce(cbind, samples)
maxlist <- lapply(split(bindedcols, seq(nrow(bindedcols))), which.max)
data.in <- (t(unname(data.frame(nx.list))))
colnames(data.in) <- c('trials', 'successes')
out <- list(data.in,
table(unlist(maxlist))/sum(table(unlist(maxlist))),
apply(Reduce(rbind,intervals), c(1,2), round, rnd)
)
names(out) <- c("input", "probs", "cred.int")
out
}
MVTest()</code></pre>
<!-- /wp:code -->
